p:IGI+

IGI's next generation program for Integrated Geochemical Interpretation
p:IGI+ is IGI's replacement for p:IGI-3. Not just a progressive update from p:IGI-3, but a complete software rewrite from the ground up to enable:
- Extensibility - enhanced property model, with unlimited user columns and support for much larger projects
- Maintainability - reviewed design of our software to enable us to improve and add features with ease in the future
- Usability - a much more modern user interface to reduce barriers to use, including a full undo system, while retaining the existing drag and drop feel
- Features - new data model enables far richer features including support for map exploration, full well integration, PCA and enhanced visualisation options
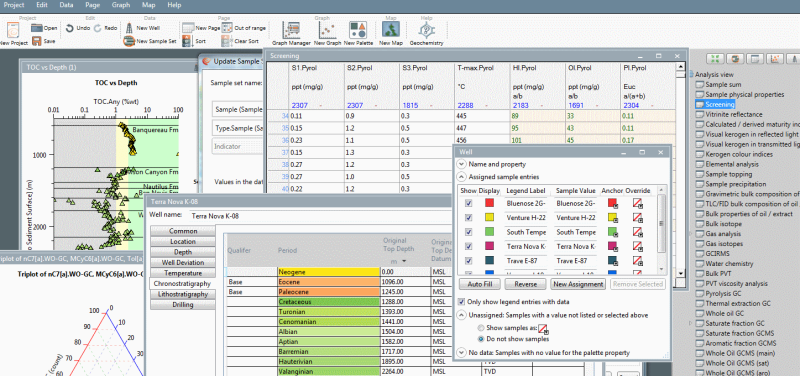
Information on the recent releases and new features in p:IGI+ is a available in the news section of the web site.
Key features currently supported include:
- An extensive data model support all widely used geochemical analyses, and full support for gas and molecular data
- Support for adding an unlimited number of your own properties that fully integrate with the system
- Importing data from text, Excel, p:IGI-3 and p:IGI-3 Well Manager files, and merging data from a variety of sources
- Automatic calculation of derived ratios and properties based on raw data
- Viewing and editing of data in flexible spreadsheets with control over units of measure etc
- Graphing of data: histograms, cross-plots, tri-plots, line plots, depth plots, star plots, multi-depth plots, time series plots, with intuitive interaction and high quality output
- Autographs for commonly used interpretative plots for quick investigation of your data
- Brushing of data across graphs, maps and pages, creation of both rule based and graphical selection based sample sets
- Flexible palettes for colour, shape and size with intuitive drag and drop interaction
- Easy calculation of (stratified) statistics and intuitive interaction with palettes and sample sets
- Interactive multivariate statistics support using PCA
- Flexible mapping of text, date-time and number properties, integrated with palettes and sample sets
- Full well model including MD to TVD conversion and support for tops to sample stratigraphy assignment
- Undo support throughout the application and for all data changes
A good place to get an overview of p:IGI+ is the developing User Guide or the downloads page for demo projects and other resources. Looking forward we will see additional features added including:
- Rule based systems for assigning class labels etc
- Better integration between p:IGI+ and Metis
- Improved control and delivery of changes to the property model
We are also reviewing support for wireline LAS files and gas log data and exploring how to best include more advanced data science tools such as clustering, regression and classification models.
If you are interested in getting more information, or a demonstration of p:IGI+ please contact us using the button below.
Contact us for more information about IGI software
Fill in the form to get in contact
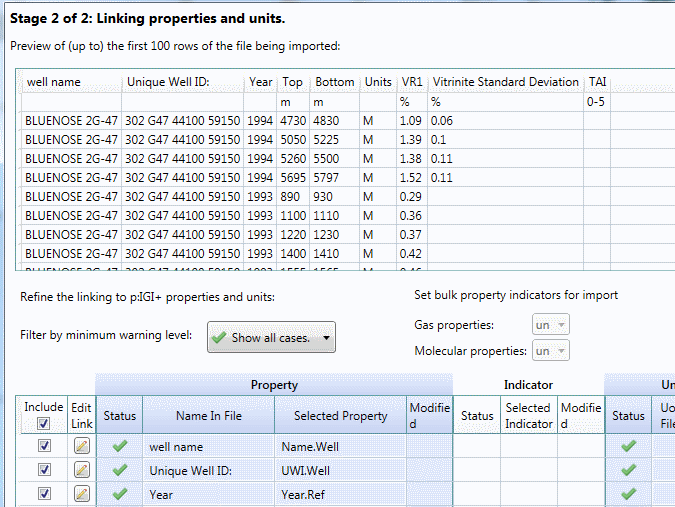
Import of text, Excel and p:IGI-3 data, with an easy to use, semi-automated import system with full alias support.
Import well data including deviation surveys, stratigraphy, temperature data and auto-populate sample data.
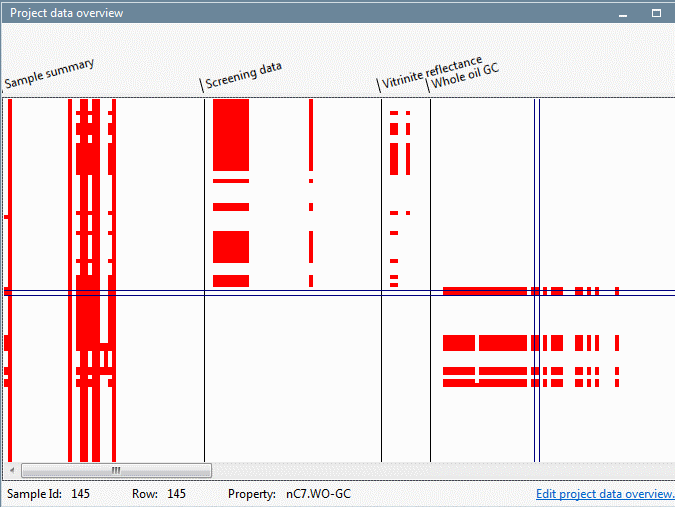
Review your data with import summary statistics and the project data overview to show where you have data.
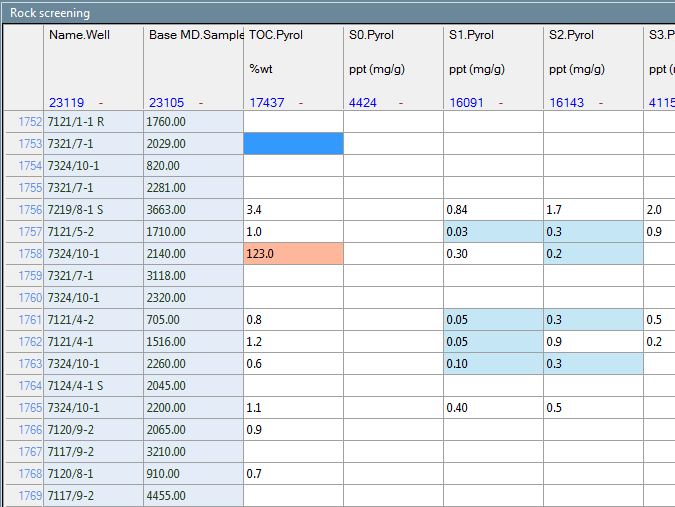
Easy editing using a geochemistry aware spreadsheet with support for equations, units and customisation.
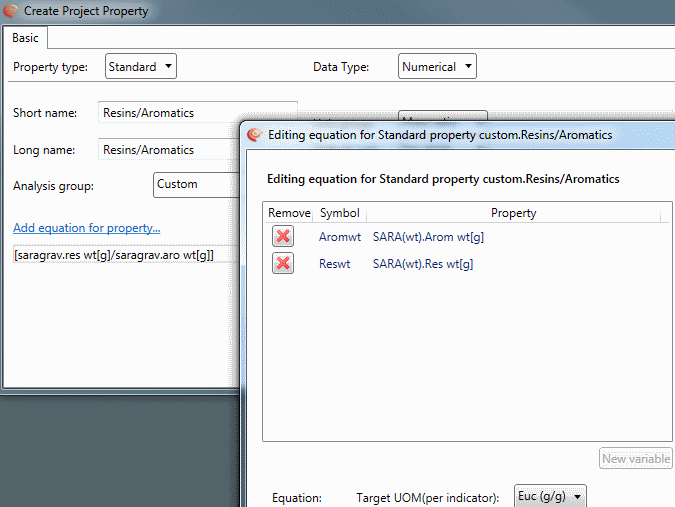
Define your own properties to add to our extensive model, and seamlessly integrate these with the whole system.
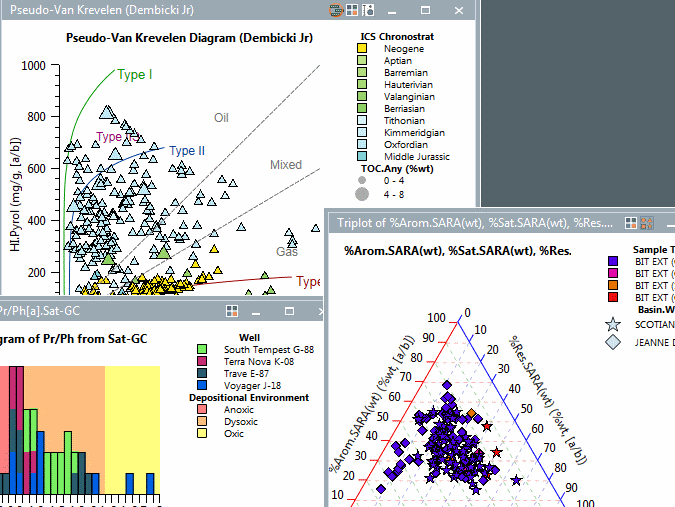
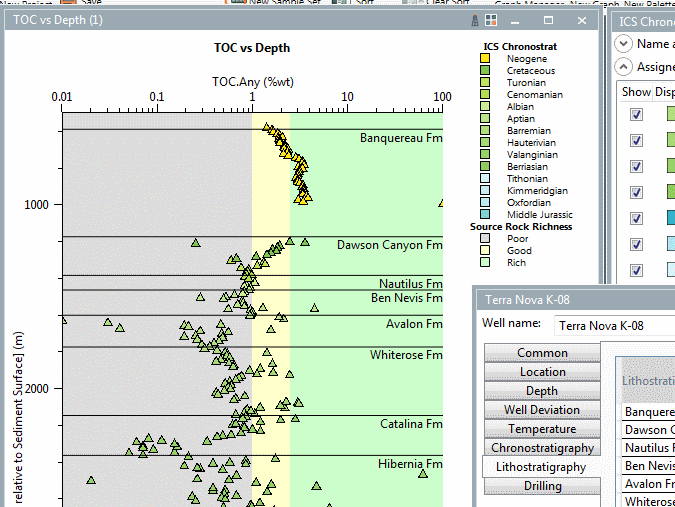
Powerful graphing, including histograms, scatter plots, depth plots, triangle plots and line plots.
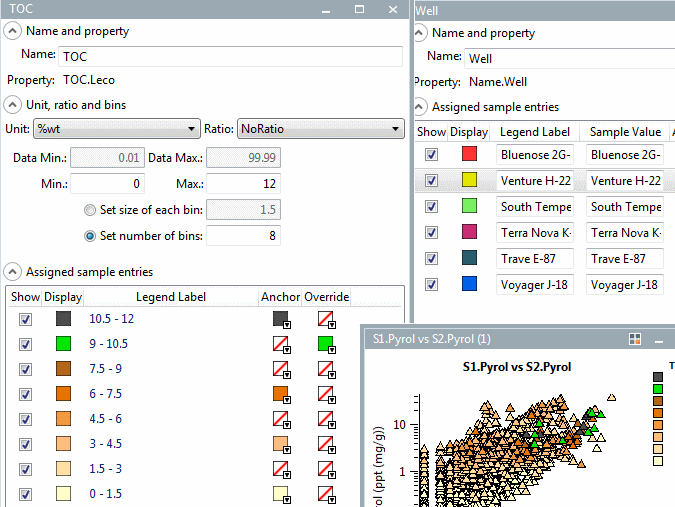
Create colour, size and shape palettes, save as templates to share with colleagues; drag on graphs to apply.
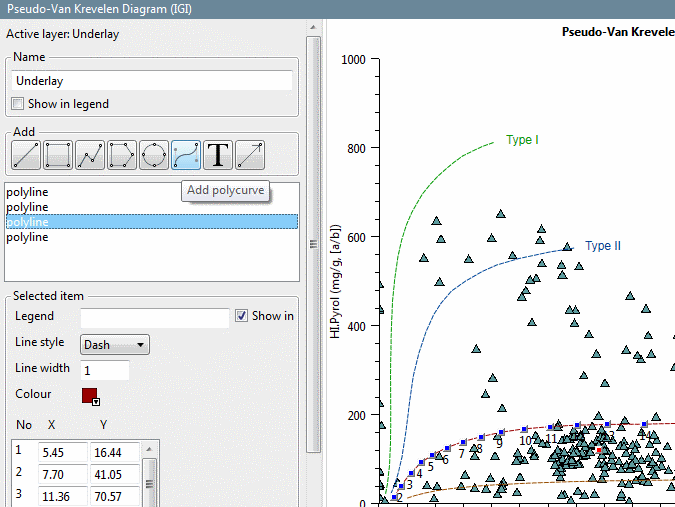
Use range of predefined industry standard graphs, and create and share your own interpretative overlays.
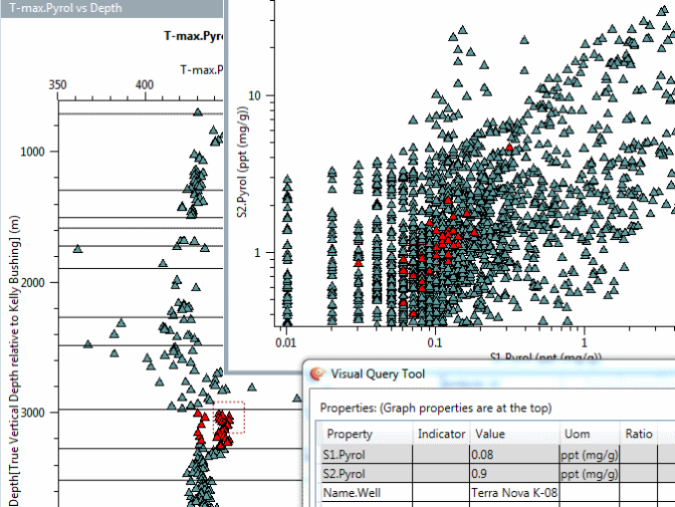
Brush data across graphs, maps and pages, to identify unusual or interesting data or easily create samples sets.
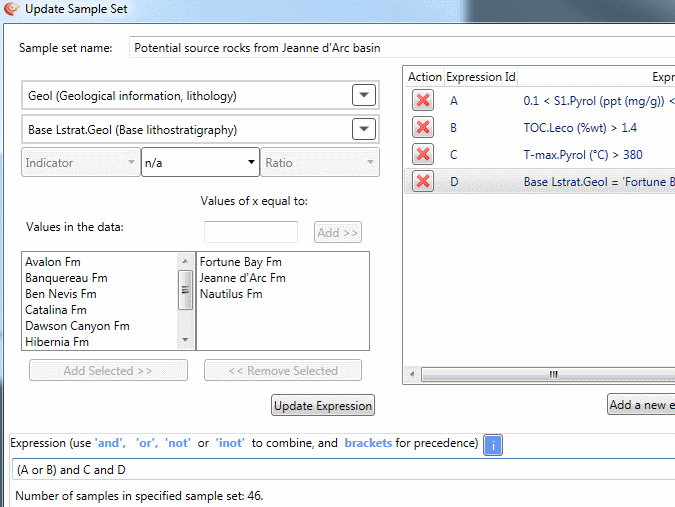
Easily create filters for your data (sample sets) based on complex criteria to find the data of interest.
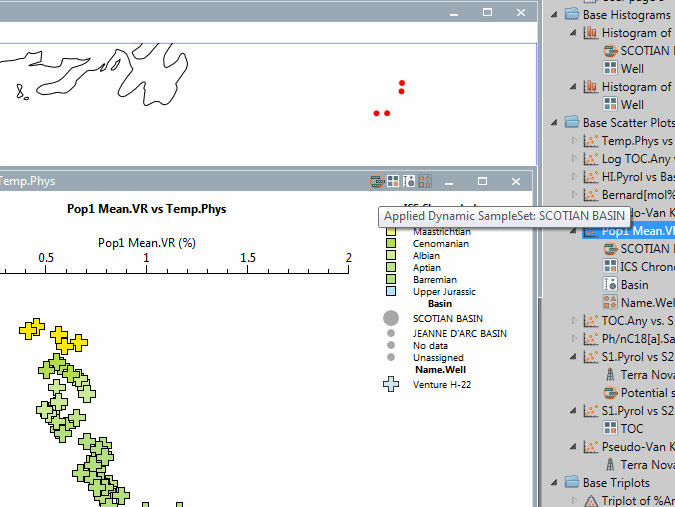
Drag and drop to apply sample sets, wells and palettes to efficiently explore your data in graphs, and maps.
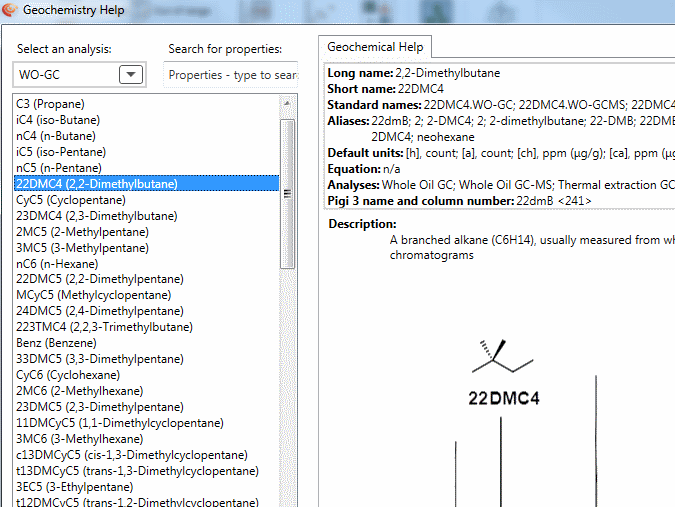
Obtain geochemical help for all IGI properties in the system, and easily find the properties you want to use.
More information
Further resources
There are several resources to support p:IGI+.
p:IGI+ user guidep:IGI+ downloads
System requirements
Supported Operating Systems:
- Windows 10 and 11 (supported)
- Windows Server 2016 and upwards (both virtual and physical installs)
The minimum system requirements:
- Version 6.0 of the .NET Framework (from version 2.1 onwards)
- WPF Rendering Tier 1
Hardware recommendations
We’d recommend running p:IGI+ on a machine with an Intel i5 or better processor, and at least 4Gb of memory, however we have tested p:IGI+ across a wide range of machines, and while performance degrades on less capable machines, p:IGI+ will continue to run. We are still actively improving the performance of p:IGI+, and anticipate improving responsiveness in the future.
We recommend a screen resolution of Full HD (1920x1080 pixels) or better when using p:IGI+, with a dual monitor setup the most productive configuration.
Using p:IGI+ remotely
We have tested p:IGI+ in the following remote access systems:
- Windows Remote Desktop (from Windows Server 2016)
- Windows Remote Desktop Applications
